Statistical/Data Analysis
1. Exploratory Analysis of Primate Hand and Foot Digit Proportions:
Read full paper Here.
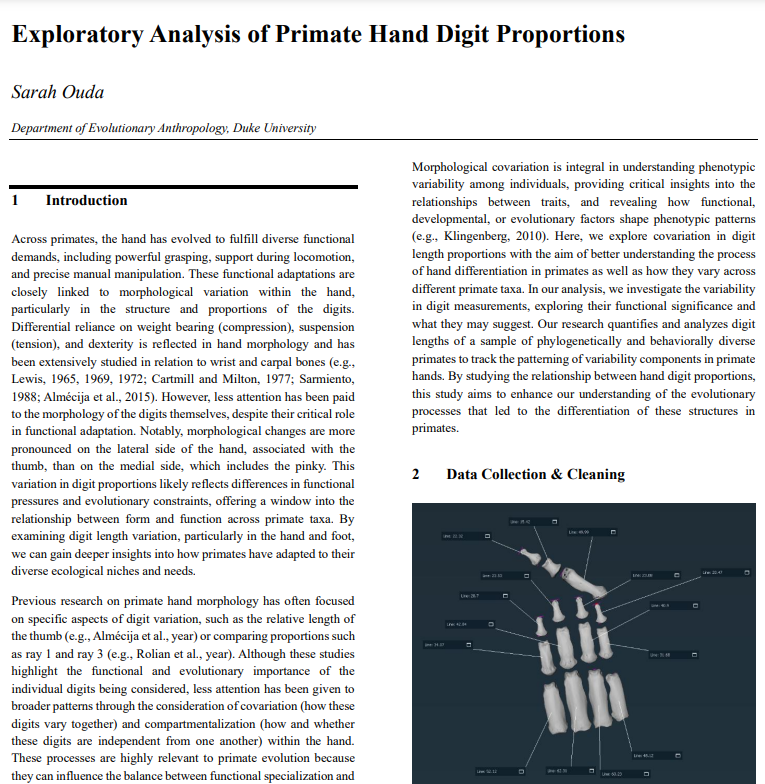
This semester, I completed an independent study with the objective of analyzing an unused autopod digit length dataset given to me by the Boyer Lab at Duke University. The aim of the project was to enhance our understanding of the evolution of hand proportions in primates and exploring potential covariation present among digits.
For this project:
I spent a fairly significant amount of time in the data collection & preprocessing stage. The dataset I was given was incomplete and contained many gaps and underrepresented taxa groups. To supplement this, I needed to collect CT scans for each missing taxa and measure each associated manual bone (the metacarpals, proximal phalanges, and intermediate phalanges) using the biological modeling software, Avizo.
Normalized digit lengths by calculating the geometric means of the metacarpal/phalange lengths for each individual
Performed a principal component analysis (PCA) on the normalized digit length data to identify major axes of variation and covariation among the different bones
Wrote final report summarizing significance + methods + results of study
2. Chance in Games: A Look into Luck vs Skill
Read full paper w/code Here.
I recently participated in the 2024-2025 TriComm Math Modeling Competition in which we were tasked to build a model predicting the 2024 March Madness winner in 48 hours.
Highlights:
Gathered and preprocessed historical game log data for the 2022 and 2023 season of our 68 teams. This was surprisingly the bulk of this project and took us over 15 hours to complete.
Created a skill metric based on skill + consistency
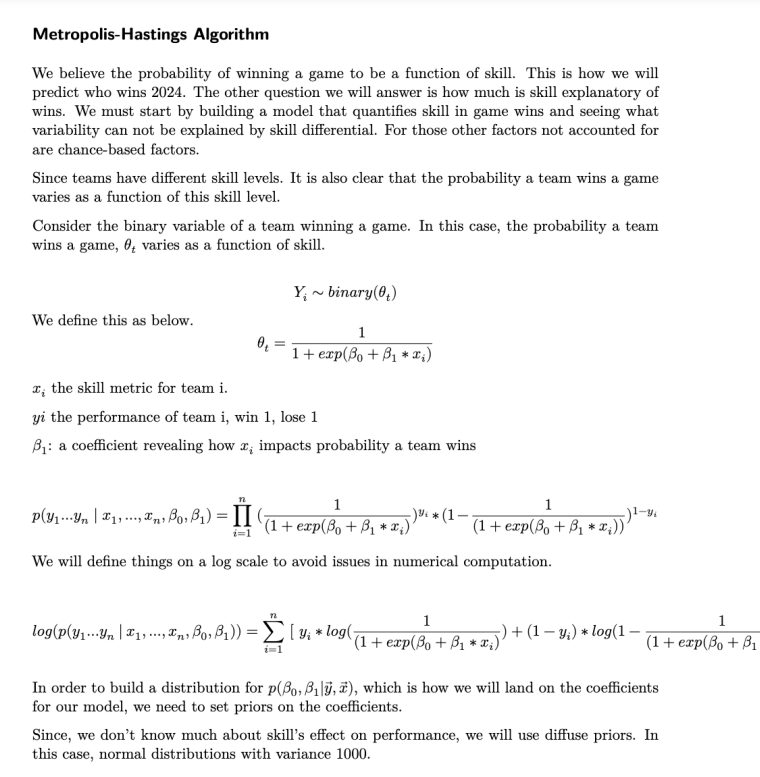
Modeled team wins as a function of skill under informative priors — Utilized Metropolis-Hastings Algorithm
Determined to what extent wins could be explained by a team’s skill and how much was left to chance
In reality, UConn won March Madness 2024. Our model predicted UConn was second most likely to win (out of 68 teams)—not too shabby, right?
Our team received special recognition by judges for sound mathematical modeling and innovative analysis
3. Predicting Profit Amongst Fortune 1000 Companies
Read full paper Here.
Regression Analysis Paper done using R.
Highlights:
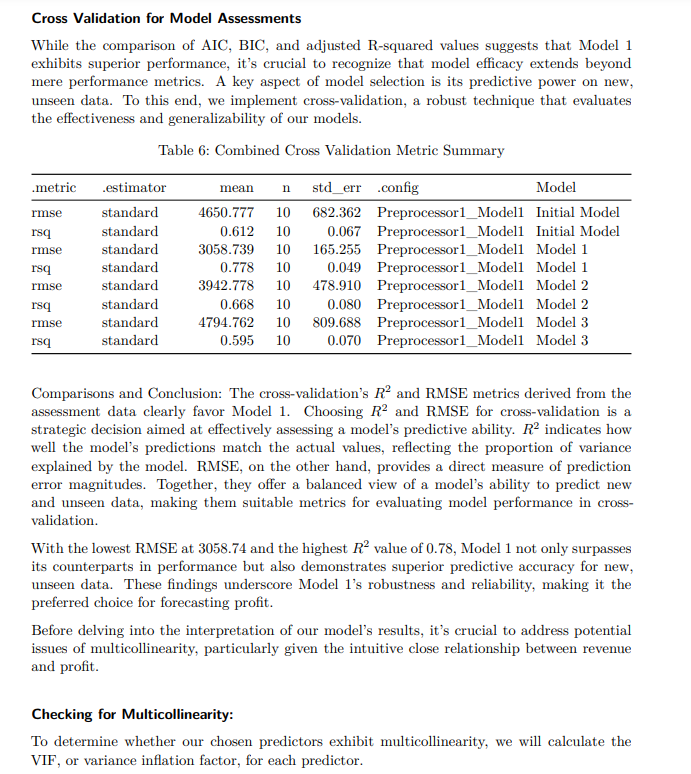
Fit several linear models to predict profit on dataset with over 1000 observations and checked for multicollinearity of predictors by calculating variance inflation factor (VIF values)
Ran initial model comparisons using AIC/BIC and implemented cross-validation by calculating Root Mean Squared Errors (RMSEs) and r-squared values of models
4. GoodReads and Gender: An NLP Analysis of Gender Perceptions in Book Reviews
Read full paper Here.
Highlights:
Developed and trained five Word2Vec models on genre-specific datasets to uncover linguistic associations between gender and literary stereotypes in a database of over 15 million Goodreads book reviews, ultimately presenting our findings to professors and students in statistics department
Executed a comprehensive data cleaning process using the langdetect library and NLTK toolkit, followed by deep learning techniques to vectorize and analyze text, revealing significant gender bias patterns across genres
Utilized cosine similarity metrics and data visualization libraries to measure and compare the orientation of word vectors, identifying strong linguistic associations between gendered words and stereotypes
Designed a classification algorithm using tokenization to identify male-centered versus female-centered reviews through weighted counts of gendered language, and analyzed rating distributions to determine the impact of gender focus on review ratings


